Ice - A 50 Year Snapshot of Lake Beulah History
For the last fifty years, from her home on Country Club Lane, Ann Alger has been watching the weather and keeping track of ice formation and melting on Lake Beulah. When asked how this data collecting started she replied,
My mother would say, “Remember last year when we were wearing sweatshirts on the Fourth of July?” And I didn’t remember it that way at all! So I decided that I would keep a weather journal which I have done now for 50 years. There is never any question now about previous temperatures, rainfall, snow totals, etc.
Ann’s method was simple and straightforward. When the lake as viewed from her place was entirely covered with ice, she called it ‘closed’. When there was no ice visible she called it ‘open water’.
Until now all those records were just part of a long list of dates that included when the ice formed and when it broke up. But today, thanks to the power of modern technology and the efforts of Dan Roepke from Camp Charles Allis, that data is no longer just a list of dates, but a story of the Lake and its history.
A graph is a picture of numbers and it has been said that, ‘A picture is worth a thousand words’. So let’s take a look at Ann’s data…
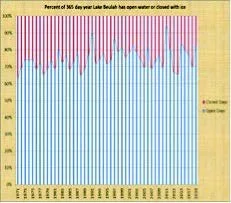
This is a graph of all fifty years of Ann’s data. The red shows the percentage of days the lake was ice covered. Blue shows percentage of days of open water for each of the last fifty years. There are a few interesting things here. For example it shows 1971 had the greatest percentage of days of ice cover. But this graph is not the only way to look at Ann’s data.
What you’re seeing here in this second graph below are all of Ann’s records from December 1970 through March 2020. The top (blue) line shows fifty years of data on how many days the lake was clear of ice (open water). The bottom (red) line plots the number of days Lake Beulah was ice covered.
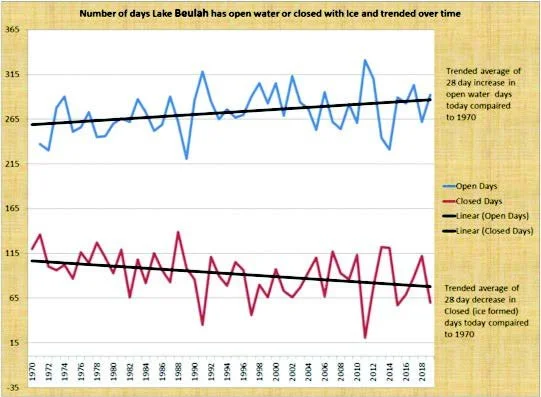
On both top and bottom graphs, the dark line shows the clear ‘trend’ is towards a lot more days of open water and fewer days of ice cover.
But of course, as Ann pointed out last December
Contrary to what is happening on the other end of the lake, our end has not frozen yet and of course is currently thawing. I am quite sure that when this all plays out there will seem to be differences on agreement as to when it actually freezes. People who live on Mill or East Shore RD for instance have been telling us for weeks that they are all solid ice. Interesting isn’t it?
Yes. All data is but a snapshot in time.
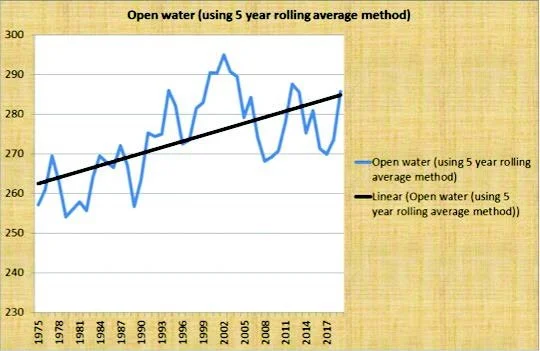
Looking at the data a bit differently, the above graph showing the 5 year rolling averages of open water helps mitigate for wildly cold or warm weather extremes that might end up skewing the picture, but doing so without ignoring those years. The dark trend line again makes it clear there has been a big change over the last fifty years.
So over the years, whether they realized it or not, people like Ann around Lake Beulah have seen a major shift towards more open water and less ice. The causes of this phenomenon might lead to conjecture so for now we’ll leave it up to readers to make their own judgment.
One question those of us at Lake Beulah today might ask is, ‘How might this change in ice cover affect the lake and its ecology?’ That’s something for another article. Watch for it in the next issue of Lake Views.
It’s likely that not too many lakes have this much ice on/ off information, a fifty year snapshot of Lake Beulah History. Thanks Ann!